

Smart Water Quality Monitoring System with AI
Research Article • Article ID: IJREK-2026-00152
Abstract
Water quality is an important factor for aquatic ecosystems, agriculture, aquaculture and human activities. Dissolved oxygen (DO) is one of the important indicators of water condition because changes in its concentration can affect aquatic organisms and indicate changes in the surrounding environment. The selected Base Paper 5, “Measuring dissolved oxygen in pond water with high-resolution by optical gas sensor,” presents a high-resolution optical DO sensor based on a nanoporous anodic aluminum oxide (AAO) membrane and Platinum(II) meso-tetrakis (pentafluorophenyl) porphyrin (PtTFPP). The reported response of the sensor was 26.2 on the AAO membrane compared with 6.5 on a glass substrate, with a response time of approximately 16 s and recovery time of approximately 190 s. This seminar research proposes an extension of the DO monitoring concept into a Smart Water Quality Monitoring System with A
Keywords
2.1. Dissolved Oxygen Monitoring
DO monitoring is important because oxygen availability directly influences aquatic organisms. The Base Paper 5 discusses titration, electrochemical and optical approaches and highlights the advantages of photoluminescence-based optical sensing. In optical sensing, the interaction between oxygen and an indicator molecule changes the emitted optical signal. PtTFPP is one of the indicator molecules used for oxygen sensing. The paper uses an AAO membrane with approximately 200 nm pore size. The nanoporous structure provides a large surface area and channels that facilitate interaction and diffusion. The
PtTFPP-containing sol-gel matrix is spin-coated on the membrane. A glass substrate is used as a comparison. The reported intensity response ratio I0/I was substantially higher for the AAO-supported sensor than for the glass-supported sensor [1].
2.2. Optical Quenching Principle
The optical sensing mechanism is based on phosphorescence quenching. When the PtTFPP molecule is excited by light, its Table 1: Base paper and proposed research comparison.
Base Paper 5 Proposed Extension
Optical DO measurement Smart water-quality monitoring AAO nanoporous membrane DO as primary input PtTFPP in sol-gel pH and temperature as supporting inputs Sensor response measure- Data preprocessing and AI/ML ment analysis DO concentration estimation Good/Normal/Poor classification excited state can transfer energy to oxygen. The resulting reduction in phosphorescence intensity is related to the oxygen concentration. The Base Paper 5 describes this behavior using the Stern–Volmer relationship. In its ideal form, the relation can be written as Sensor performance evalua- tion
3.2. Research Gap
Proposed dashboard and alert layer
I0 = 1 + KS V [Q] (1) I where I0 is the emission intensity in the absence of the quencher, I is the emission intensity in the presence of the quencher, KS V is the Stern–Volmer quenching constant and [Q] represents the quencher concentration. For DO sensing, oxygen acts as the quencher [1].
2.3. Water Quality Parameters
Although DO is the primary parameter of this proposed system, a single parameter does not describe all aspects of water quality. pH provides information about the acidity or alkalinity of water, while temperature affects chemical and biological processes and also influences oxygen solubility. Therefore, DO, pH and temperature are selected as the initial input parameters for the proposed intelligent monitoring framework.
3.1. Base Paper 5
The selected Base Paper 5 is titled “Measuring dissolved oxygen in pond water with high-resolution by optical gas sensor” by Genanew Mulugeta Kassaw, Annada Sankar Sadhu and Sajal Biring. It was published in 2025 in Sensors and Actuators B: Chemical, volume 443, article 138270 [1]. The research paper develops and characterizes a nanoporous AAO-supported optical DO sensor using PtTFPP embedded in a sol-gel matrix. The reported response I0/I at 8.4 mg/L DO was 6.5 ± 0.8 for the glass substrate and 26.2 ± 1.4 for the AAO membrane. The paper further reports a response time of 16 s and recovery time of 190 s for the AAO sensor. In pondwater evaluation, the reported DO value was approximately 7.71 mg/L using the proposed sensor, while comparison measurements were close to this value [1]. Base Paper 5 is focused on developing a high-resolution optical sensor for DO measurement. Its main contribution is sensor design, characterization and practical DO measurement. The paper does not present the proposed project architecture in which DO, pH and temperature are jointly processed by an AI/ML classification layer to provide a simple overall waterquality category. This difference forms the research gap addressed by the proposed seminar work.
3.3. Proposed Contribution
The proposed contribution is an intelligent interpretation layer over the DO monitoring concept. DO remains the primary parameter because it is directly derived from Base Paper 5. pH and temperature are added as supporting water-quality parameters. The collected values are proposed to be organized into a dataset, cleaned and prepared for classification. A suitable Machine Learning model can then learn relationships between the input parameters and water-quality categories. The final result can be displayed through a dashboard and undesirable conditions can be associated with alerts.
4.1. System Architecture
The proposed architecture follows a sequential flow from water sampling to intelligent interpretation. The system is designed as a future implementation framework rather than a claim of a completed hardware or software system.
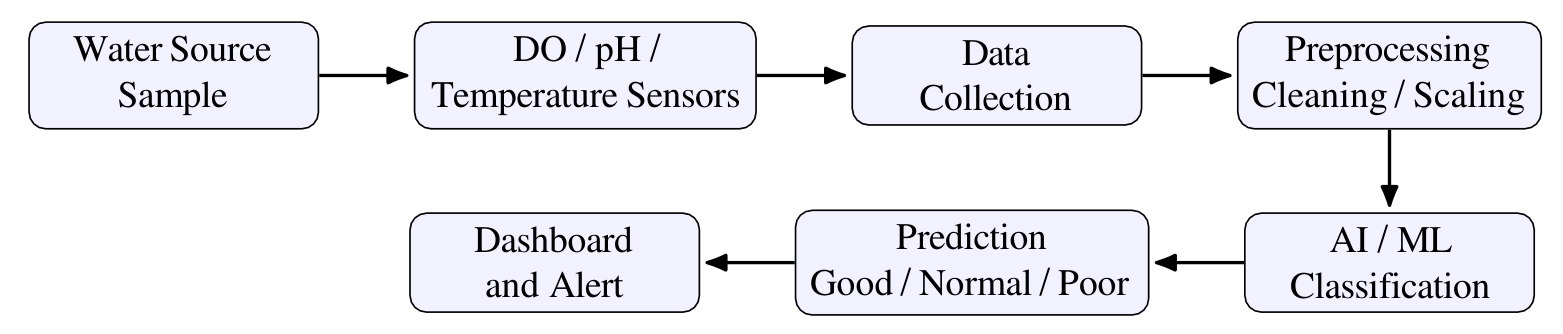
4.2. Input Parameters
The proposed system initially considers three parameters. Dissolved oxygen is the primary parameter and is linked directly to the optical sensing concept of Base Paper 5. pH is included as a supporting chemical parameter, while temperature is included because it influences water conditions and oxygen behavior.
Table 2: Proposed input parameters.
Parameter Role
Dissolved Oxygen Primary parameter based on Base Paper 5 (DO) pH Supporting water-quality parameter Temperature Supporting environmental parameter
5. Proposed Workflow and Data Flow
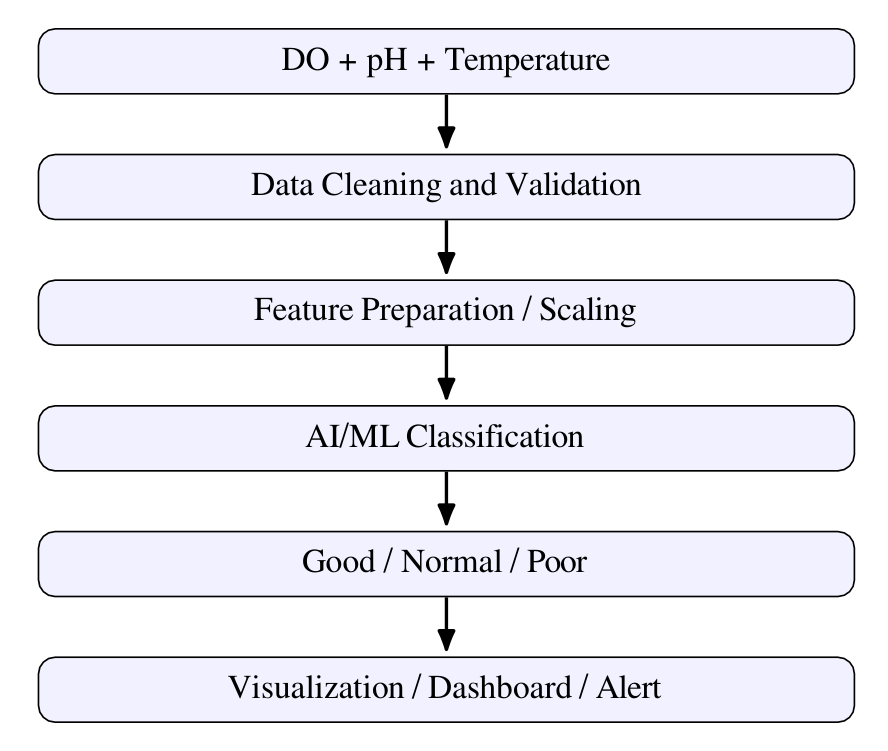
The working process can be divided into data collection, preprocessing, AI/ML analysis, prediction and result presentation. The following flow represents the proposed intelligent extension of the optical DO sensing concept.
4.3. Data Collection and Preparation
In a future physical implementation, water-quality information can be collected using appropriate DO, pH and temperature sensors. Alternatively, a suitable water-quality dataset can be used for developing and testing the AI component. The values can be stored in CSV format or a database. Each record can contain DO, pH, temperature and a corresponding water-quality label for supervised classification. Before model training, the data should be checked for missing values, inconsistent readings and abnormal records. Appropriate preprocessing can include missing-value handling, scaling where required and separation of input features from the target class. The preprocessing stage is important because the quality of the input data directly affects the reliability of a classification model.
4.4. AI/ML Classification
The proposed AI/ML layer receives the processed DO, pH and temperature values. Classification models such as Decision Tree, Random Forest or Support Vector Machine can be considered during future implementation. The objective is not to claim that one particular model has already achieved a specific accuracy, but to define a framework in which models can be trained and compared. The target classes are defined as Good, Normal and Poor for simple interpretation. The exact class boundaries should be established from an appropriate water-quality standard, dataset labels or experimental measurements during future implementation. Thus, the classification output should not be treated as an experimentally validated result in the present seminar paper.
4.5. Dashboard and Alert Concept
The proposed dashboard can present the latest DO, pH and temperature values, trends over time and the predicted waterquality category. If the predicted condition is undesirable, an alert can be generated. In a future IoT-based version, the dashboard can receive data remotely and store historical readings for analysis.
The first stage receives water-quality values. The second stage checks data quality. The third stage prepares the features for model input. The fourth stage applies the selected classification model. The fifth stage converts the model output into an understandable category, and the final stage presents the result to the user. The data flow can therefore be described as: water source → sensors or dataset → structured data → preprocessing → AI/ML model → prediction → dashboard/alert. This flow provides a simple separation between measurement and intelligent interpretation.
6. Methodology The proposed methodology consists of the following steps. 1. Water-quality data acquisition: Obtain DO information using the optical sensing concept of Base Paper 5 and include pH and temperature values when available. 2. Dataset creation: Organize the measurements into a structured dataset containing the selected input parameters and water-quality labels. 3. Data preprocessing: Identify missing, inconsistent or invalid records and prepare the dataset for model development. Water Source Sample DO / pH / Temperature Sensors Data Collection Preprocessing Cleaning / Scaling Dashboard and Alert Prediction AI / ML Classification AI/ML Classification Feature Preparation / Scaling Data Cleaning and Validation DO + pH + Temperature Visualization / Dashboard / Alert
4. Feature preparation: Use DO, pH and temperature as initial features. Additional features may be studied later. 5. Model development: Train a suitable classification model using labelled water-quality data. 6. Prediction: Apply the trained model to new observations and generate Good, Normal or Poor classification. 7. Visualization: Display the input parameters and prediction through graphs or a monitoring dashboard. 8. Alert mechanism: Associate undesirable predicted conditions with a warning or notification in a future implementation.
7. Expected Results and Discussion
The proposed system is expected to provide a structured method for converting water-quality measurements into an understandable condition category. The primary contribution of Base Paper 5 is retained through the use of optical DO sensing as the foundation. The proposed extension adds multiple parameters and intelligent classification. The research paper reports that the AAO-supported optical DO sensor achieved an I0/I response of 26.2 at 8.4 mg/L DO compared with 6.5 for the glass-supported sensor. It also reports a 16 s response time and 190 s recovery time. These are published results of Base Paper 5 and are not results of the proposed AI system [1]. For the proposed system, actual classification accuracy, precision, recall, F1-score and confusion matrix values cannot be stated without implementing and testing the AI model on a suitable dataset. During future implementation, these metrics can be calculated and different classification models can be compared. The expected practical output is a category such as Good, Normal or Poor together with the measured parameter values. The proposed dashboard can make the interpretation of water-quality information easier. Instead of requiring a user to manually inspect several parameter values, the system can summarize them as a condition category. This can support quicker identification of undesirable changes. However, the reliability of such classification depends on the quality of the dataset, sensor calibration, class definitions and model validation.
8.1. Sensor and Data Acquisition Layer
The measurement layer is responsible for obtaining the basic water-quality observations. In the proposed framework, the optical dissolved oxygen sensing concept from Base Paper 5 forms the basis of the DO measurement stage. A suitable pH sensor and temperature sensor can be included to obtain the supporting parameters. A data-acquisition unit can periodically read the sensor values and transfer them to a computer, controller or IoT device. The acquisition interval should be selected according to the application and sensor response characteristics. For a pondmonitoring application, repeated measurements can be stored with a timestamp so that changes can be studied over time. Each observation can therefore contain a timestamp, DO value, pH value, temperature value and, when available, the corresponding water-quality class.
8.2. Data Storage Layer
The proposed system can initially use a CSV file because it is simple to create, inspect and process using Python. For a larger deployment, a database or cloud storage service can be used. A typical record structure is shown in Table reftab:dataset. Table 3: Illustrative structure of the proposed dataset.
Field Example type Purpose Timestamp Date/time Identifies measurement time DO Numeric Primary water-quality input pH Numeric Supporting chemical input Temperature Numeric Supporting environmental in- put Label Categorical
The values shown in such a table are field definitions rather than experimental measurements. The final training dataset must be collected or obtained from a suitable validated source. Labels should be assigned using an appropriate water-quality standard or reliable expert-defined criteria.
8.3. Preprocessing Layer
Raw sensor observations can contain missing values, duplicated records, measurement noise or inconsistent units. The preprocessing layer can identify these issues before the values are supplied to the model. Missing records may be removed or treated using an appropriate imputation strategy. Numerical variables can be checked for reasonable ranges, and units should be made consistent. Feature scaling may be required for some Machine Learning models, particularly distance-based algorithms. The preprocessing procedure must be applied consistently to training and future prediction data. The purpose of this stage is to reduce avoidable data-quality problems rather than to artificially improve model performance.
8.4. Prediction Layer
After preprocessing, the model receives the selected input features. If the feature vector is represented as X = [DO, pH, T ], the model can be expressed conceptually as f (X) → Y (2) where T represents temperature and Y is the predicted waterquality category. The possible output classes are Good, Normal and Poor.
Pred. G Pred. N Pred. P Actual G Actual N Actual P – – – – – – – – – The final class boundaries are application-dependent. Therefore, a future implementation should first define the target labels using accepted water-quality criteria and then train the model on representative data. The classification model should be evaluated on data that was not used for training.
8.5. Monitoring and Alert Layer
The monitoring layer can display the current sensor readings, historical trends and predicted class. A simple interface can show DO, pH and temperature as separate indicators and the predicted water condition as the overall summary. If the output is Poor or another undesirable condition is identified, the system can generate an alert. For an IoT extension, the monitoring layer can be connected to a cloud database. This can allow authorized users to view data remotely, compare measurements over time and receive notifications. Such functions are considered future scope in the present seminar work.
9. AI/ML Model Evaluation Framework
The proposed system requires a systematic evaluation procedure before any model can be selected. The dataset should first be divided into training and testing portions. The training data can be used for model development, while the testing data should remain unseen until evaluation. If the dataset is sufficiently large, cross-validation can also be considered. Several classification algorithms can be investigated. A Decision Tree can provide an interpretable set of decision rules. Random Forest can combine multiple decision trees and may provide more robust classification for varied data. Support Vector Machine can also be considered for classification after suitable feature preparation. The purpose of considering multiple models is to identify a suitable model for the available dataset rather than assuming one algorithm will always be best. Performance can be evaluated using accuracy, precision, recall and F1-score. A confusion matrix can show how many observations from each class were correctly or incorrectly predicted. For a three-class problem, the confusion matrix can be represented conceptually as follows.
Table 4: Conceptual three-class confusion matrix.
The dashes in Table 3 indicate that actual numerical results are not being claimed in this seminar paper. After future implementation, the cells can contain the measured counts from the test dataset. Accuracy can then be calculated from the number of correct predictions relative to the total number of test observations. Precision, recall and F1-score can be reported for each class and as suitable averages. The evaluation should also consider practical issues. A model with high numerical accuracy but poor behavior for an important class may not be suitable for monitoring. Sensor calibration, environmental variation, class imbalance and noisy measurements can influence performance. Therefore, model selection should consider both statistical evaluation and the requirements of the intended application.
10. Advantages and Applications
The proposed framework has several potential advantages. It can combine multiple water-quality parameters instead of relying only on a single measurement. It can provide automated data preprocessing and classification and can present the result in a simple form. It also provides a foundation for continuous monitoring and future IoT integration. Potential application areas include aquaculture ponds, environmental monitoring, agricultural water monitoring, educational laboratories and community-level water observation systems. In aquaculture, DO monitoring is particularly important because oxygen availability affects aquatic organisms. A future system could use real-time sensor readings to identify changing conditions and notify the operator. The proposed system is also suitable as a research extension because additional parameters can be incorporated later. Turbidity, conductivity, Total Dissolved Solids (TDS), nitrate, phosphate and other relevant parameters can be considered when appropriate data and sensing methods are available.
11. Limitations
The present work is a seminar research proposal and does not claim a completed physical sensor system or a deployed AI application. The proposed Good, Normal and Poor classes require suitable standards or labelled datasets before actual model training. The selection of the best AI/ML model also requires experimental comparison. The optical DO sensor performance reported in Base Paper 5 cannot automatically be assumed for a future student-developed system because sensor fabrication, calibration, environmental conditions and instrumentation may differ. Similarly, the reported 7.71 mg/L pond-water DO value is a result of the published research paper and should not be presented as a measurement made by the proposed project.
12. Future Scope
Future development can extend the system in several directions. First, additional water-quality parameters such as turbidity, conductivity, TDS, nitrates and phosphates can be incorporated. Second, different Machine Learning and Deep Learning algorithms can be compared using experimentally collected or validated datasets. Third, IoT connectivity can be added so that sensor values are transmitted to a cloud platform for remote monitoring.
A mobile application can provide notifications when an undesirable condition is detected. Historical data can be stored for trend analysis and anomaly detection. Future research can also investigate how turbidity, nitrates, phosphates and organic matter influence DO sensing and how these variables can be incorporated into intelligent water-quality classification.
13. Conclusion This paper proposes a Smart Water Quality Monitoring System with AI based on the optical dissolved oxygen monitoring concept presented in Base Paper 5. The selected paper develops a high-resolution optical DO sensor using a nanoporous AAO membrane and PtTFPP-based sensing material and reports improved response compared with a glass substrate. The proposed research retains DO as the primary parameter and extends the concept by adding pH and temperature as supporting parameters. The proposed system introduces a data-processing and AI/ML layer that can classify water quality into Good, Normal or Poor categories. A dashboard and alert mechanism are proposed for future implementation. The main new contribution is therefore the extension from high-resolution DO measurement toward multi-parameter intelligent water-quality interpretation. Actual AI accuracy and complete physical or software imple- mentation are not claimed and should be evaluated in future work.
Acknowledgement The authors would like to thank the Department of Information Technology, Dattakala Group of Institutions, and the seminar guide for their guidance and support during the preparation of this seminar research work.
References
How to Cite this Contribution
Kiran Gawade et al. (2026). Smart Water Quality Monitoring System with AI. International Journal of Research, Exploration & Knowledge (IJREK), 1(1).
Distributed under Creative Commons Attribution 4.0 International (CC BY 4.0).